IN THIS ARTICLE
CPU Profiling Support for Open 3D Engine (O3DE)
A CPU Profiler is used to monitor the performance of your processor while running the editor or game. It collects timed events so you can easily identify the sources of slowdowns in the codebase.
Tip:The code behaves differently between debug and release build, so you will very likely want to only profile release build to look at the performance issues of your application.
Overview
Quick definition of profiler types
There are multiple ways to capture profiling data, each with their pros and cons:
- Instrumentation : You add Start/End events in the code, yourself. It is fast, the result is clean, but it might take a few tries until you are able to pinpoint the exact problematic area.
- Sampling : At specified intervals, data collection is done on your running program to know where the code is currently executed. Depending on the interval it can have a big performance impact. It is great to find right away the problematic area, but the amount of data can make it difficult to navigate.
- Tracing : Similar to sampling with better precision, but also bigger performance impact. It will be referred as “Sampling” from now on as we don’t need to differentiate the two for this documentation.
Profiler Gems
O3DE currently supports multiple profiling tools as Gems. While you can only have one profiling Gem enabled at a time, the Gem manager makes it straightforward to switch between them and try them all.
| Profiler | Description | Type | Platform |
|---|---|---|---|
| Built-in | Provides a quick overview of the CPU and GPU events. It is embedded via the ImGui tools. | Instrumentation | All |
| Tracy | An external free and open-source profiler which combines many features making it a hybrid profiler. Online demo | Instrumentation (with optional sampling support) | All |
| Optick | An external free and open-source profiler widely used in the games industry. The development has halted in recent years, but it is feature-complete. | Instrumentation (with optional sampling support) | Windows |
| Superluminal | An external commercial profiler with strong sampling performance and UX. Widely used in the games industry. | Sampling (with Instrumentation support) | Windows |
| Pix | The official Microsoft profiler used on XBox consoles. | Sampling (with Instrumentation support) | Windows |
Adding Instrumentation markers in your code
To access the profiling markers, include <AzCore/Debug/Profile.h> in your C++ file. O3DE then forwards the markers to the enabled profiler Gem. Most use cases are covered using these two macros:
- AZ_PROFILE_FUNCTION : Start a timing event with the name of the current function.
- AZ_PROFILE_SCOPE : Start a timing event with a custom name.
A timing event is automatically ended when you reach the end of the current scope (the next “}”).
You have to provide a “Budget” argument when using any of these two macros. It is is used to group these tags under the same category. The following budgets are available by default :
- Animation
- Audio
- AzCore
- Editor
- Entity
- Game
- System
- Physics
You can create new budget types by using AZ_DEFINE_BUDGET(YOUR_BUDGET_NAME) in the global scope of a C++ file.
Example usage:
#include <AzCore/Debug/Profiler.h>

void AssetDataStream::Open(const AZStd::vector<AZ::u8>& data)
{
    AZ_PROFILE_FUNCTION(AzCore);

    // ...
    while (!m_isSuspended)
    {
        AZ_PROFILE_SCOPE(AzCore, "Scheduler main loop.");
        // ...
    }
}
While markers are not required if you use a sampling profiler, they will help you navigate your capture :
- The budget name will be visible next to the event name.
- Events from the same budget group will share the same color in the external profiler application.
Given that the sampled events won’t have these additional informations, your markers will stand out in the capture and provide context about the surrounding area.
Using the Built-in profiler (All platforms)
Enabling the Built-in Profiler Gem
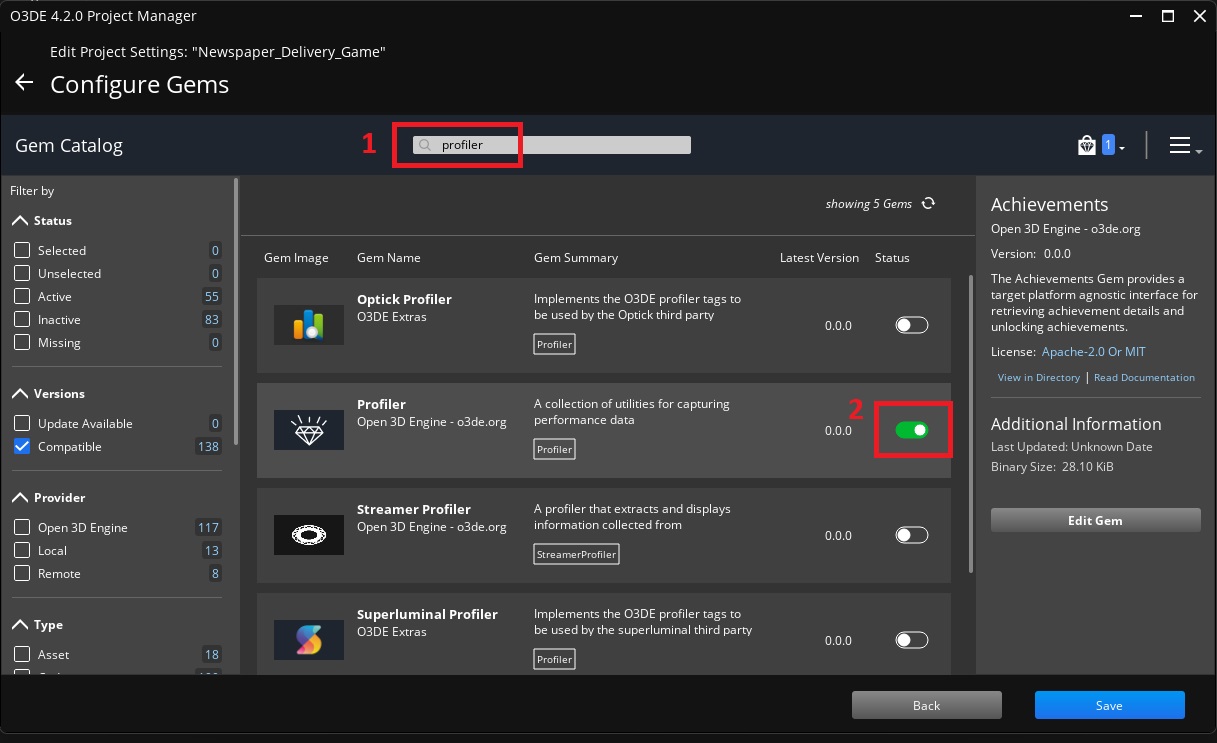
The built-in profiler is an optional Gem from the core O3DE repository. Follow
this documentation to learn how to use the project manager to enable gems. In the gem manager, search for Profiler to find and enable the gem.
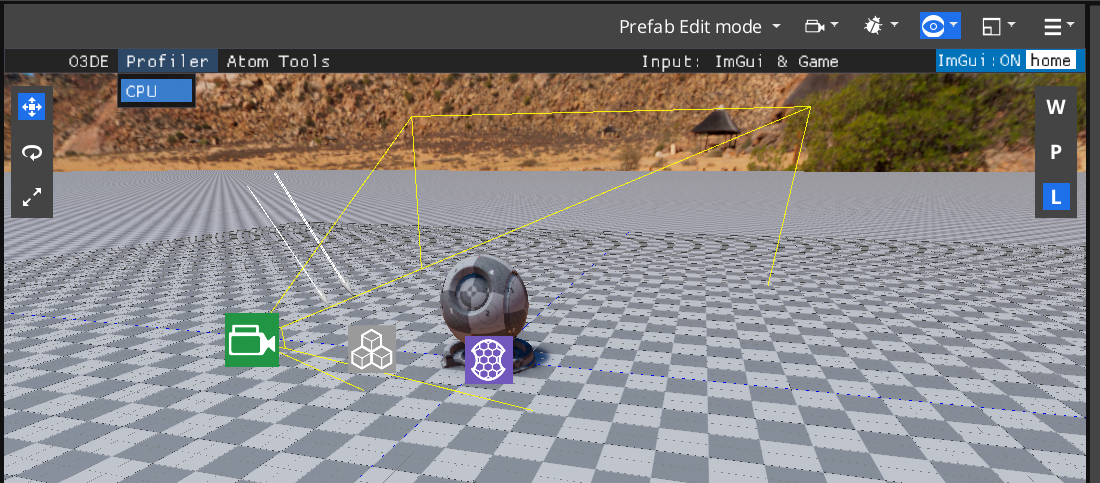
Opening the Profiler
The Profiler is embedded inside the ImGui tools. Open the ImGui tools, then click on the Profiler entry in the ImGui menu to Open the CPU Profiler.
Launch a capture
The profiler stores the state of the last 10 frames in memory. Upon being opened you will see the timeline constantly updating as new frames are pushed unto the stack. Click on the Resume/Pause button in the top left to pause this update.
To capture more frames, press the Begin button. The profiler will be able to capture a maximum of 2 minutes of data at 120 frames per seconds. Once you have enough data, press the End button to stop the capture.
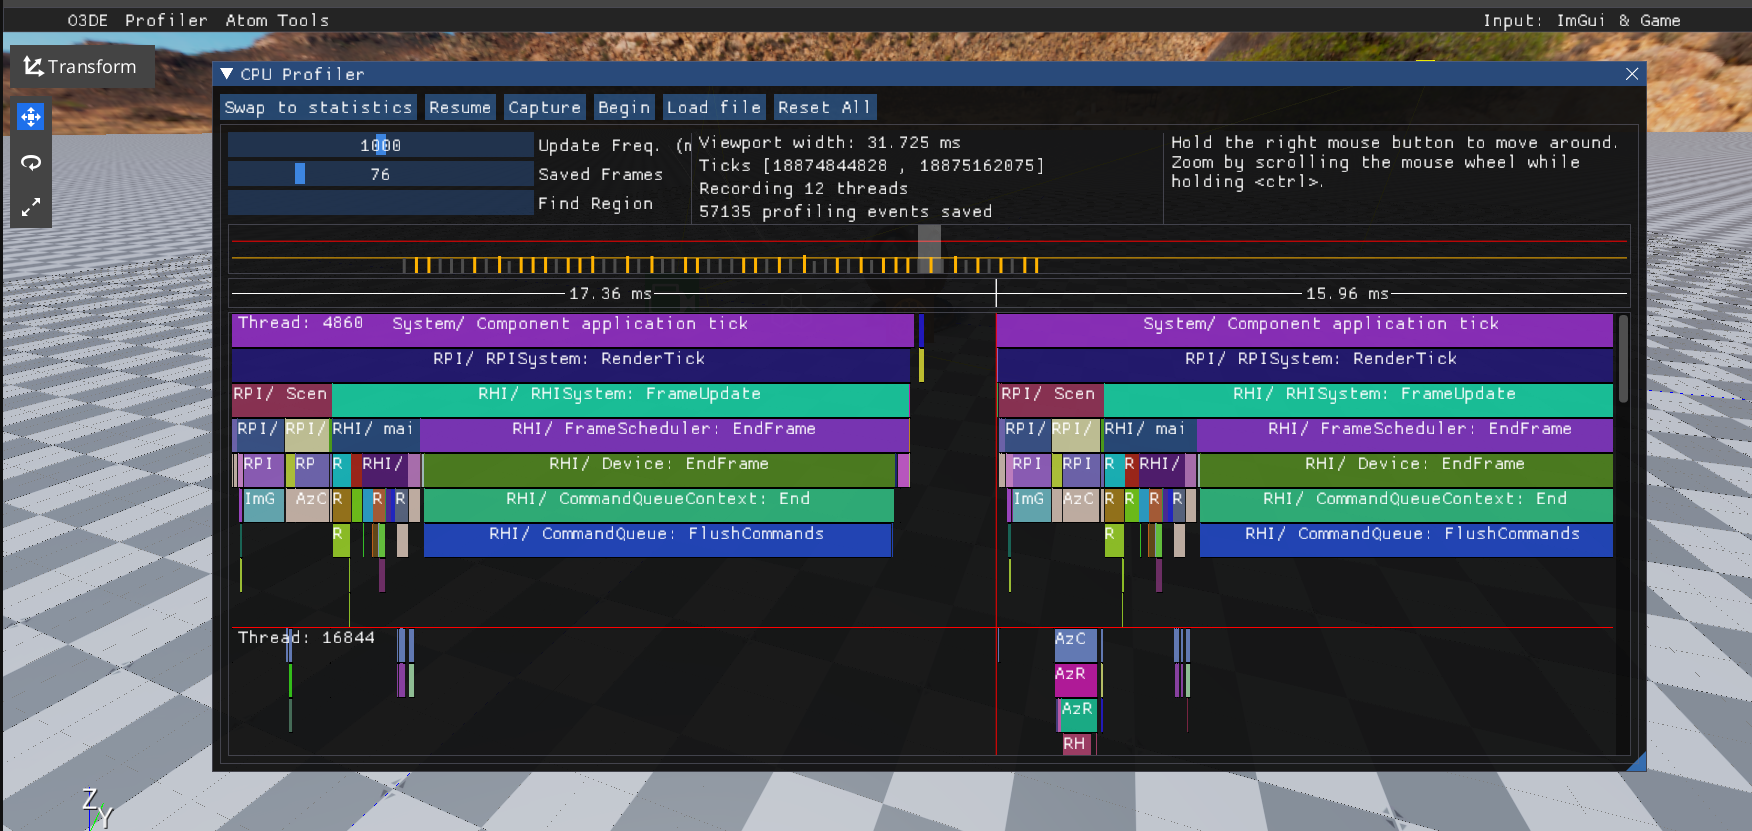
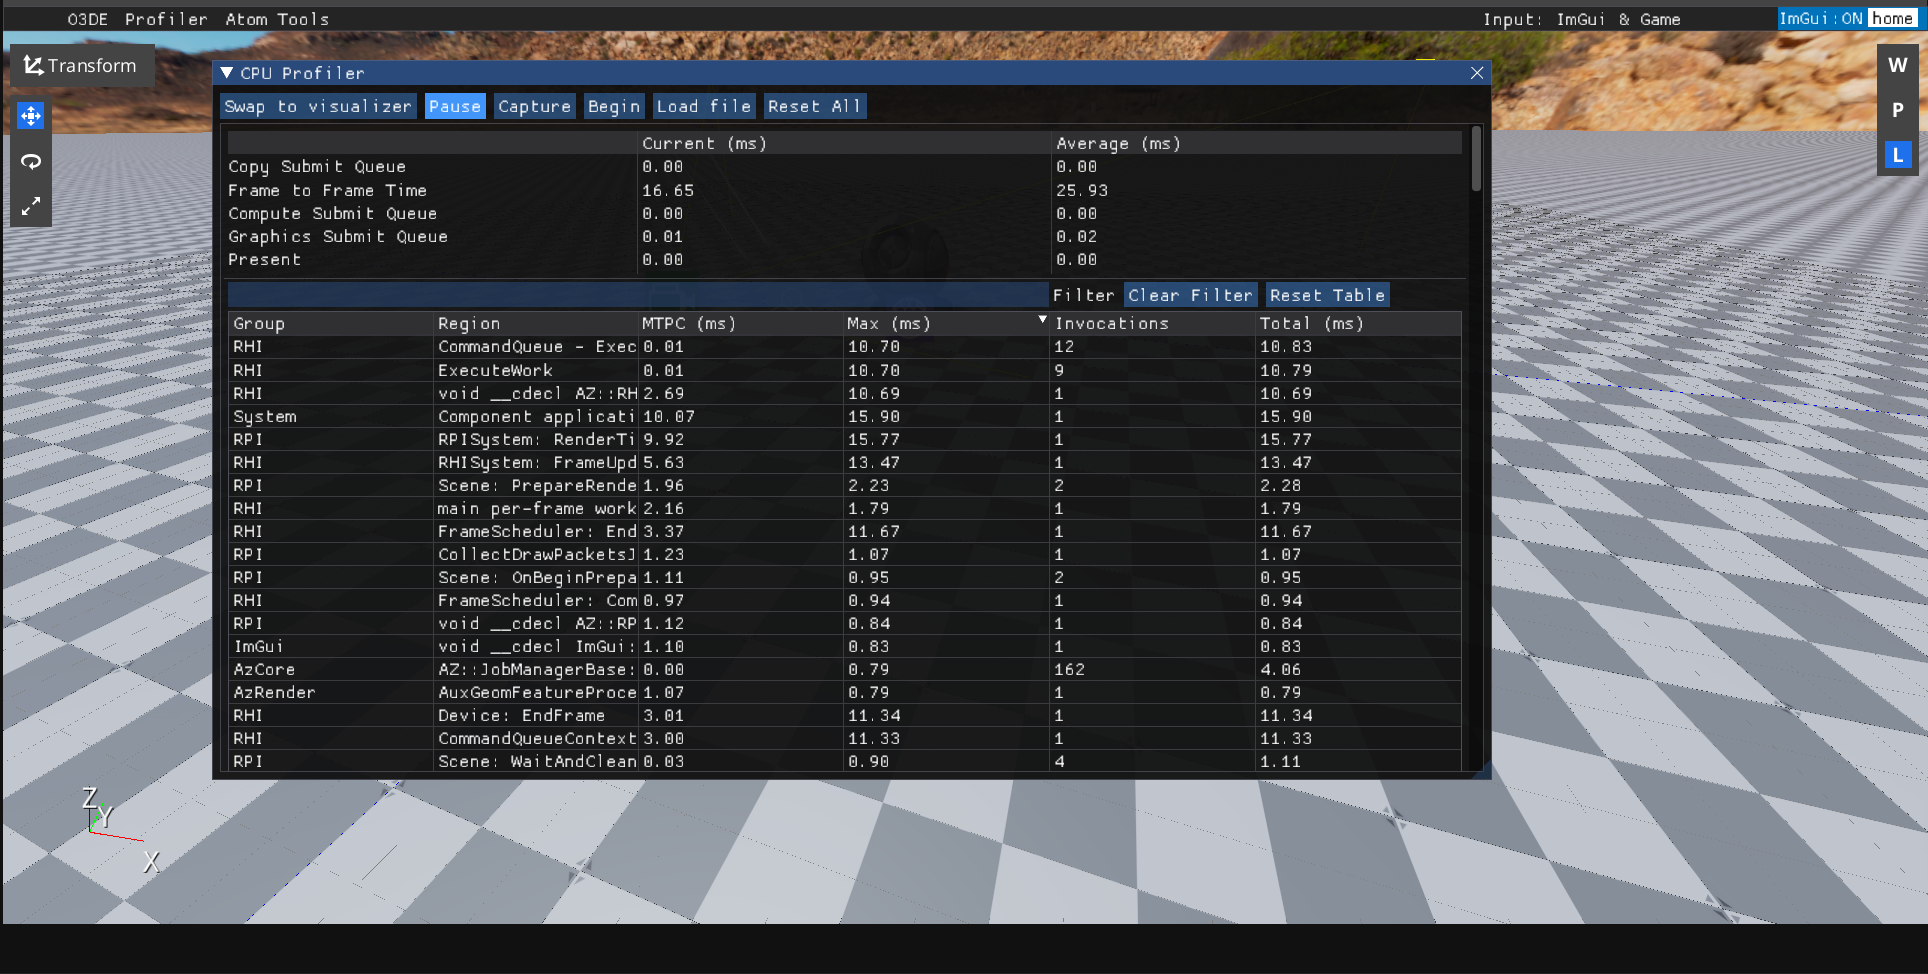
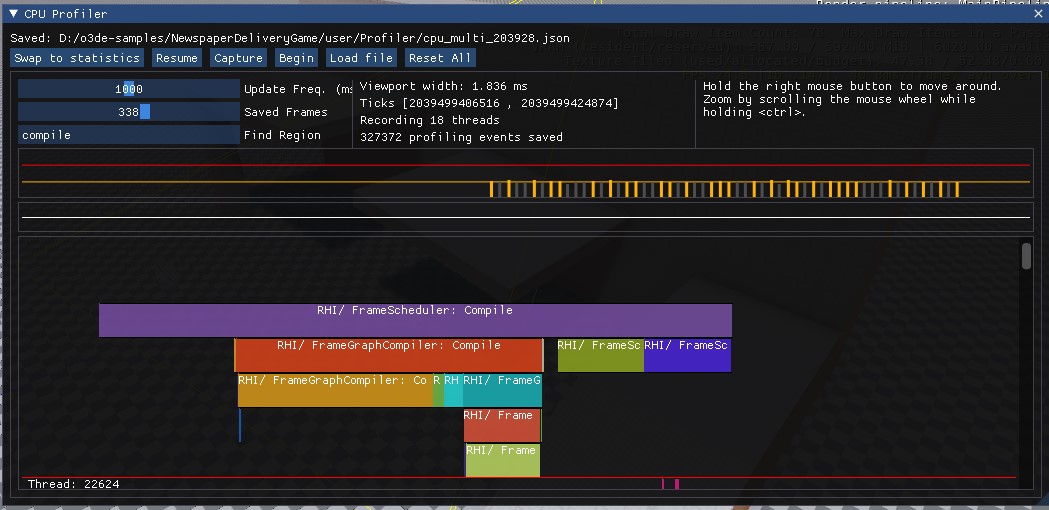
Navigate your capture
Use the mouse to navigate within the profiler. Click on Swap to visualizer/statistics to switch between the two primary views. Clicking on an item in the visualizer view will switch to the statistics view, as seen below.
Use the Find Region in the visualizer to search for specific events. The timeline is interactive, click on it with the left mouse button to focus it, then:
- Hold left mouse button to move around the timeline
- Hold the ctrl key and use the mouse wheel to change the timeline scale
To find frames that are over your budget, zoom out the timeline scale until every captured frame’s frametime is displayed in milliseconds.
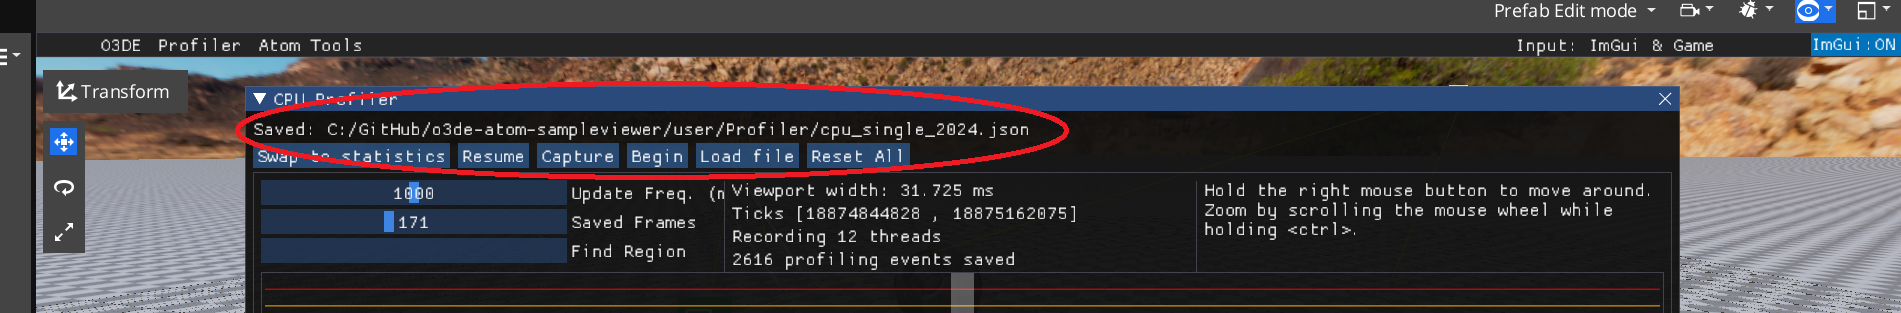
Save your capture
Press the Capture button to save your captured data in a json file. The path will be indicated right above the button. You can load any previous capture using the Load file button.
Prerequisites for Tracy, Optick and Superluminal
These profiler Gems are located in the o3de-extras github repository.
This repository follows the Remote Content format, follow the Use A Remote Repository guide to learn how to register a remote repository.
If you prefer to download o3de-extras yourself, you can follow the Register Gems guide. The profiler gems are located in
Gems/ExternalProfilersin theo3de-extrasfolder.
Once you have registered a profiler gem, enable it and rebuild the project. Refer to the first steps of enabling the Built-In profiler to see how to enable a gem for your project.
Using Tracy profiler (All platforms)
The “client” is the game or the editor while the “server” is the external Tracy application used to visualize the captured data. This application is available on windows but need to be built for other platforms.
(Windows) Grabbing the server application
You can download
the latest release from github, pick the windows-x.x.zip file. Once downloaded, extract it, the server application is tracy-profiler.exe, you will have to launch it anytime you want to make a new capture.
(Linux) Building the server application
You will have to build the application yourself, this process is outlined in the documentation file under “2.3 Building the server”. You can find a summary below :
- Install git, CMake and clang (you can learn how to set them up via the o3de documentation)
Then you can open a terminal in the folder of your choice to :
- Clone the Tracy repository. Sync to the same version used by the Gem (visible in the o3de-extra repository, under
Gems/ExternalProfilers/TracyProfiler/Code/CMakeLists.txt). Then go inside the server application folder.
git clone https://github.com/wolfpld/tracy.git
git checkout 5d542dc09f3d9378d005092a4ad446bd405f819a
cd tracy/profiler
- Install required libraries and configure the build
echo $XDG_SESSION_TYPE
If “X11” was shown
sudo apt install libdbus-1-dev libfreetype-dev libtbb-dev
cmake -B build -DLEGACY=1 -DCMAKE_BUILD_TYPE=Release -DCMAKE_C_COMPILER:FILEPATH=/usr/bin/clang -DCMAKE_CXX_COMPILER:FILEPATH=/usr/bin/clang++
If “Wayland” was shown
sudo apt install libglfw3-dev
cmake -B build -DCMAKE_BUILD_TYPE=Release -DCMAKE_C_COMPILER:FILEPATH=/usr/bin/clang -DCMAKE_CXX_COMPILER:FILEPATH=/usr/bin/clang++
Tip:TheDCMAKE_C_COMPILERarguments are not usually required, but you can run into linker issues at the end of the build when they are not set
- Build Tracy
cmake --build build --parallel --config Release --target all
If the build succeeded, you can launch the Tracy application via the following command
./build/tracy-profiler
If the build failed, it might be because of missing libraries which you can usually install via sudo apt install libNAME-dev. Else you might want to try to build using Visual Studio Code as outlined in the Tracy documentation.
Launch a capture
While not required, launching the editor or game as Administrator will allow the profiler to gather sampling data on top of the instrumentation tags (at the time of writing, tracy sampling only works on linux).
On Windows:
- Right click on the editor shortcut that you use, and select Run as administrator. You will likely want to use
--project-path="C:/Path_To_Your_Project"as launch argument if it is not present yet.
On Linux:
- Open a terminal next to your editor build. Then launch it with sudo
sudo ./Editor --project-path="/home/Path_To_Your_Project"
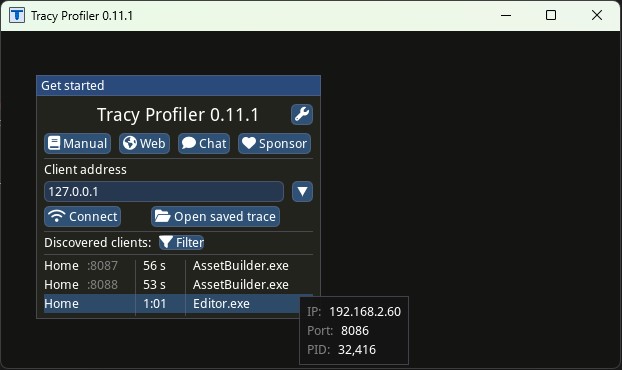
Then you can launch the tracy-profiler application that you downloaded or built. Under the connect button you should see the “Editor” process being listed. Click on it to start the capture of profiling data.
Navigate your capture
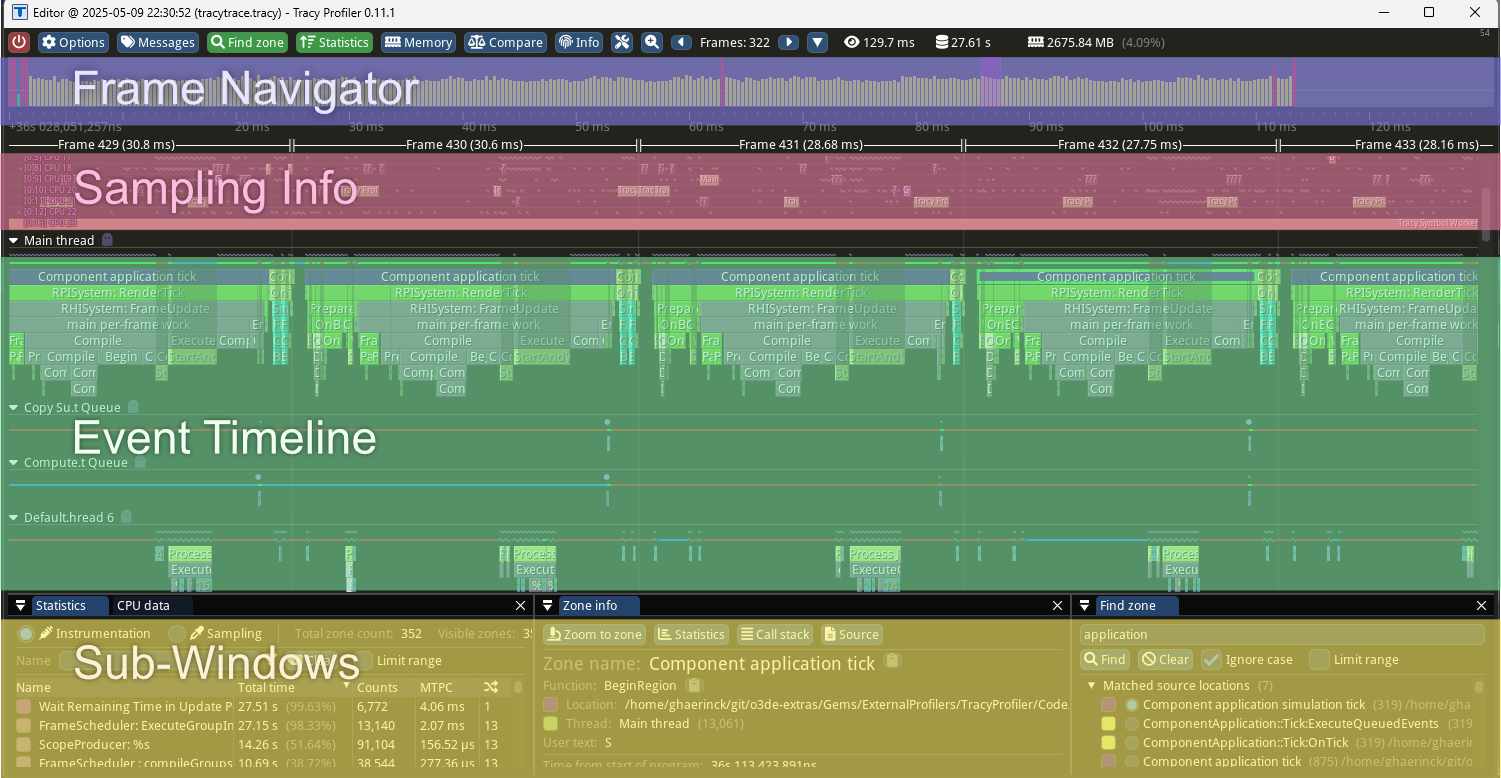
- Frame Navigator : Allow you to quickly jump to a frame which is above your 16ms target.
- Sampling Info : Allow to see the context switches, callstacks or areas without instrumenting events.
- Event Timeline : Contains all of the instrumenting events recorded. This is the main view.
- Sub-Windows : Undocked by default, these are used for advanced filtering and statistics options.
Basic navigation
Navigation is done using the mouse :
- Hold right click to move through the Event Timeline
- Use the mouse wheel to zoom-in and out of the Event Timeline
Add the middle mouse button is used to focus :
- Click on the middle mouse button to focus on the event below the cursor
- Click and drag the middle mouse button to focus on the drawn area
Basic Search
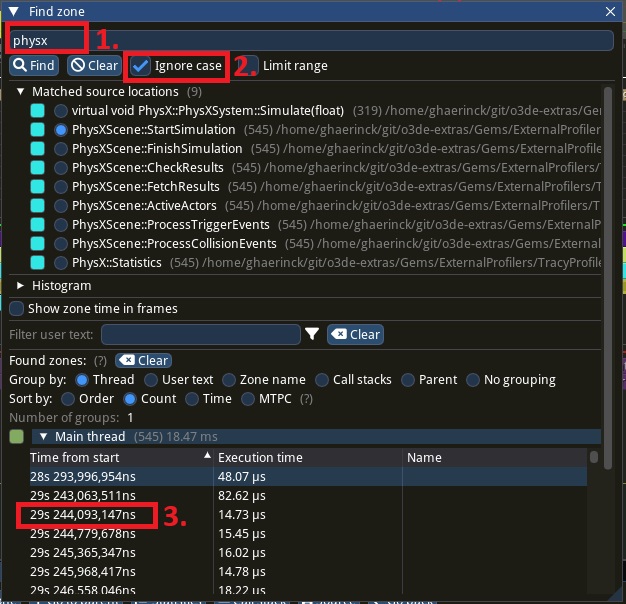
If you want to find a specific event, press ctrl + F to open the Find zone window.
- You will want to tick the
Ignore caseoption. - Enter the name of event that you want to inspect and press enter.
- Scroll at the bottom, open the dropdown with the threads name. Click with the middle mouse button to focus the timeline on the event.
Basic Analysis
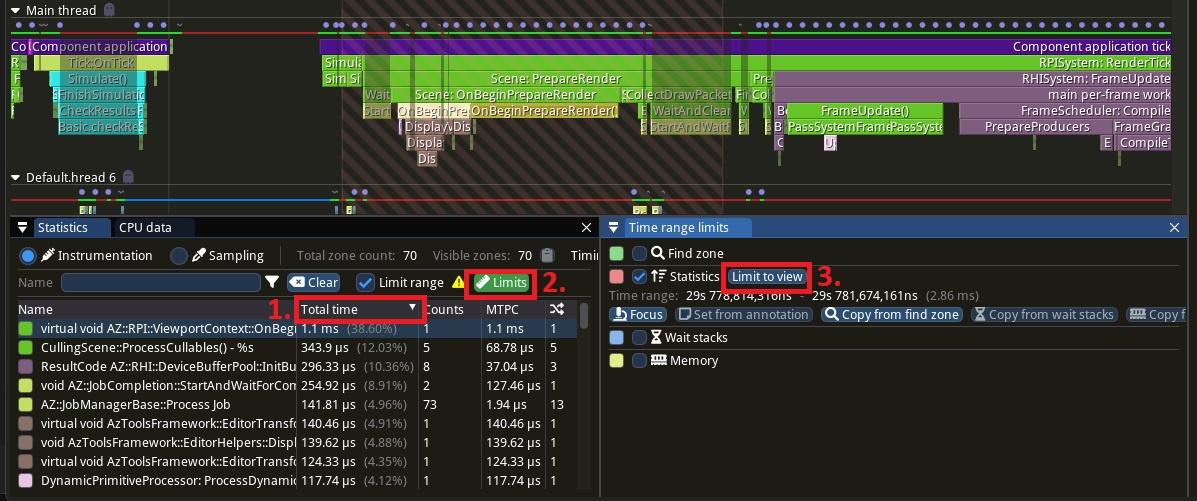
You might want to see for a given time range the most expensive events. In order to do so, open the Statistics panel
- You can order by time spent if you click on the
Total timecolumn. - Click on the
Limitsbutton to access advanced filtering - Tick the
Statisticsbutton and click onLimit to view.
The event shown in the statistics will now only contain the range in red in the timeline.
Tracy offers many advanced features that you will discover while using the tool. If needed, you can refer to the official documentation .
Using Optick profiler (Windows-only)
Tip:It is possible to profile and save the profile data for any platform, but the GUI Application used to visualize this capture is only available on windows (built with WPF). It might be possible to run it via Wine on linux, but this is outside of the scope of this documentation.
The creator of Optick made this youtube video to showcase the tool if you want to get a quick overview.
Grabbing the application
You can download
the latest release from github, pick the Optick_x.x.zip file. Once downloaded, extract it, the application is Optick.exe, you will have to launch it anytime you want to make a new capture.
Launch a capture
While not required, launching the editor or game as Administrator will allow the profiler to gather sampling data on top of the instrumentation tags. Right click on the editor shortcut that you use, and select “Run as administrator”. You will likely want to use --project-path="C:/Path_To_Your_Project" as launch argument.
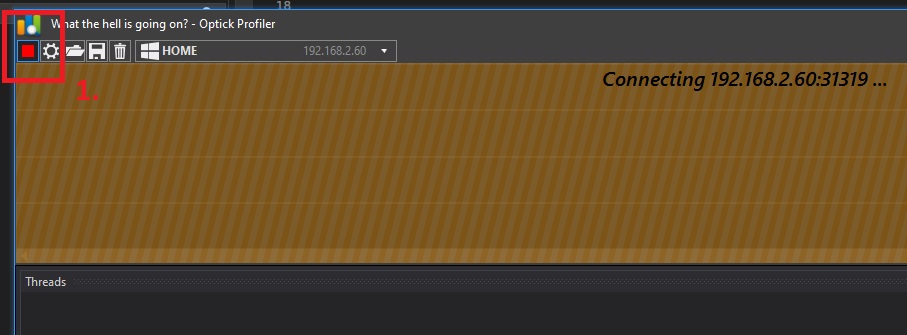
You can now launch Optick. Click on the play button in the top left corner to start the capture. Jump into game and move around until you have enough data.
Clicking on the same button will stop the capture. Make sure you click on the editor/game window afterwards so that it is able to send the last captured data to finish the profile capture.
Navigate your capture
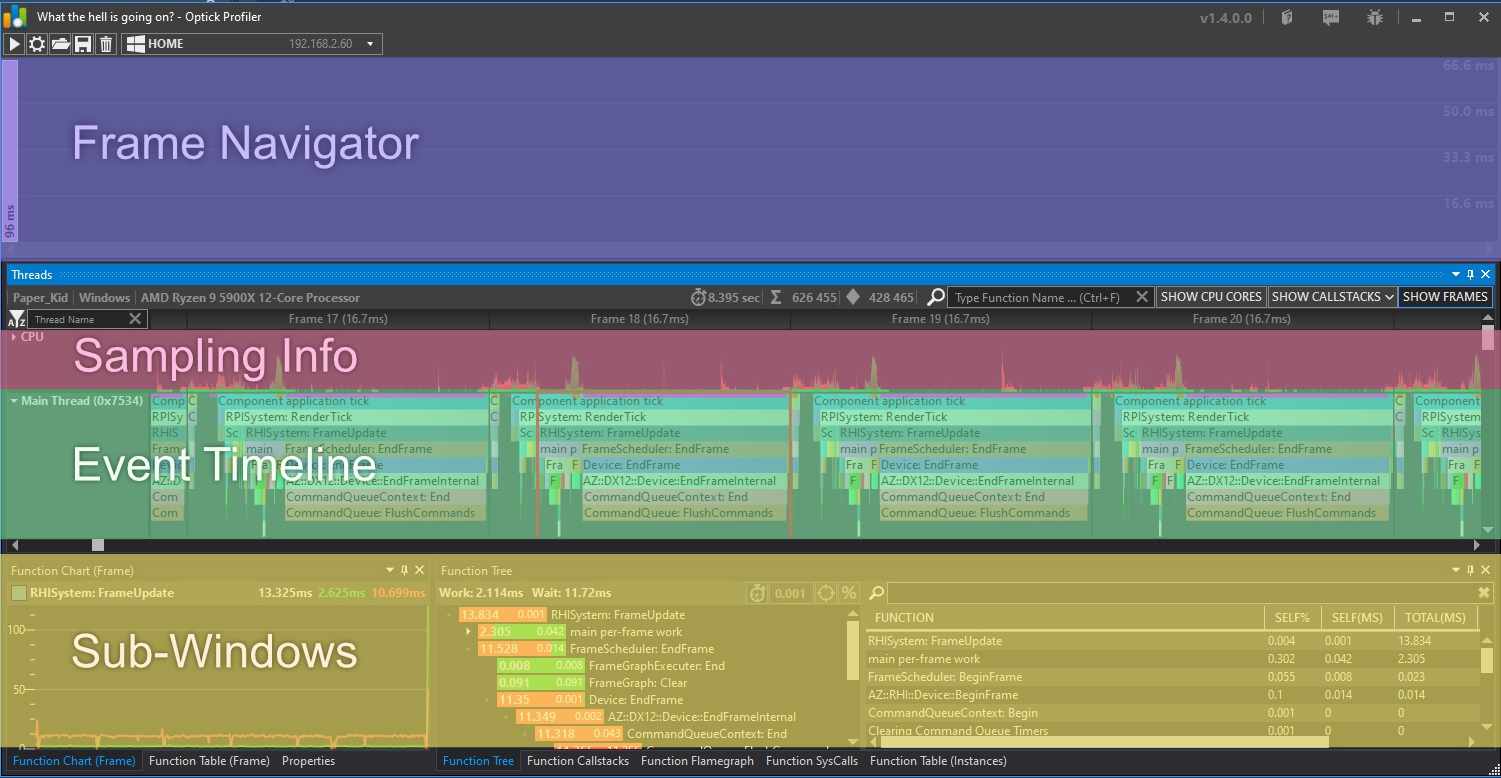
- Frame Navigator: Allow to quickly see which frames are above your budget.
- Sampling Info: Displays the CPU load, context switches and callstacks.
- Event Timeline: The main view with all of the instrumeting events.
- Sub-Windows: Advanced filtering and data search option. The “Function Flamegraph” displays sampling data.
Basic navigation
Navigation is done using the mouse :
- Hold right click to move through the Event Timeline
- Use the mouse wheel to zoom-in and out of the Event Timeline
- Left click on an event in the Event Timeline to select it, the Sub-Windows will use it as the top item
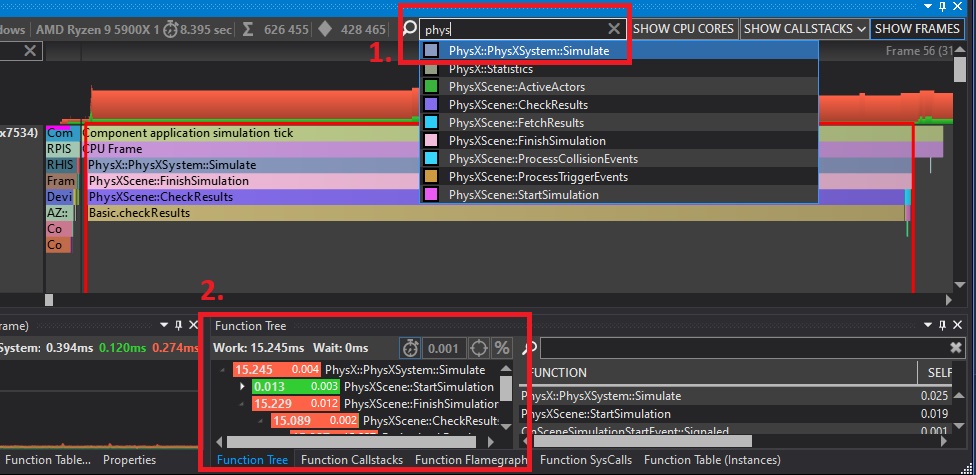
Basic Search
If you want to find a specific event, press ctrl + F and start typing.
- Use key down and key up to switch between events, and press enter to jump to it (it will pick the most expensive one amongst all the occurences)
- In the Function Tree sub-window, you will see the events below yours, with the time spent in ms. On the top right of the function tree, click on the
%button to show what each event represents in the callstack.
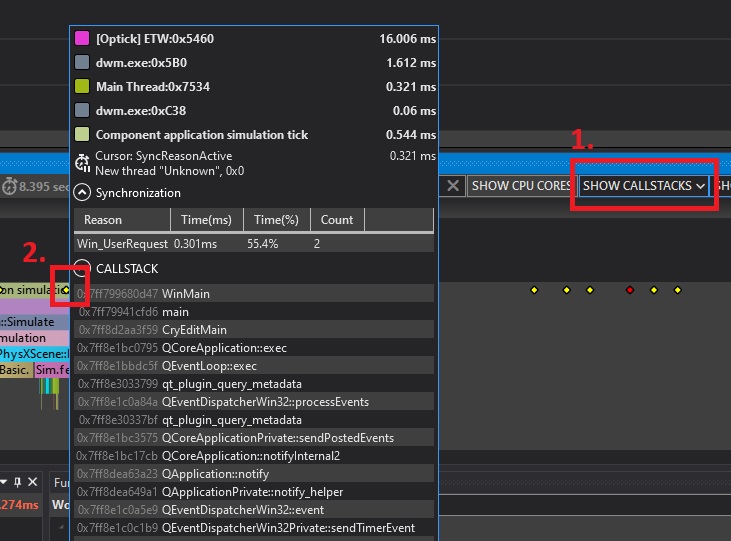
Sampled Callstack
The sampling will capture the callstacks at regular intervals. You can inspect them from the Event Timeline :
- Click on
Show callstackson the top right of the timeline - Diamonds will be shown in the timeline. Use
ctrl + Right clickon one to see the callstack. The yellow diamonds are system calls whereas the red diamonds are auto-sampling.
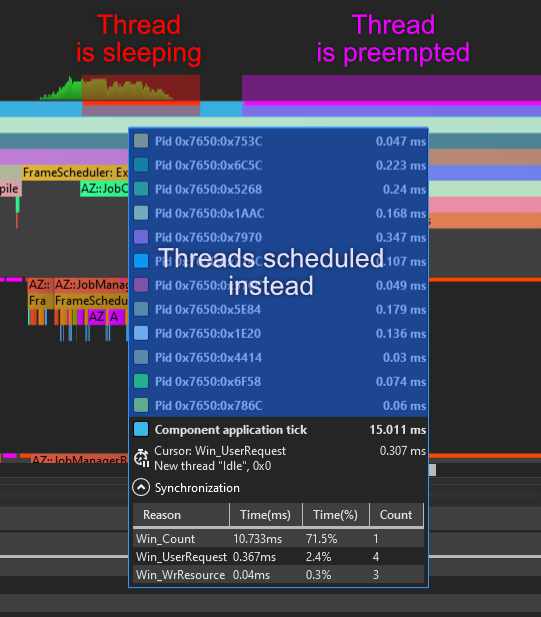
Context Switch
A context switch occurs when your thread is put to sleep so that another one can take priority. Optick differentiates two reasons for context switches :
- Preemption, shown as a thin pink line at the top of the event, can occur at anytime an higher priority thread has to take over.
- Synchronisation primitives, shown is a thin red line at the top of the event, occurs when you explicitly wait in code, for example to acquire the lock on a mutex.
If you hold control and left click in the context switch in the timeline, a dialog will open showing the threads which you took priority at this moment in time, and the time you waited for them until execution of your thread was resumed.
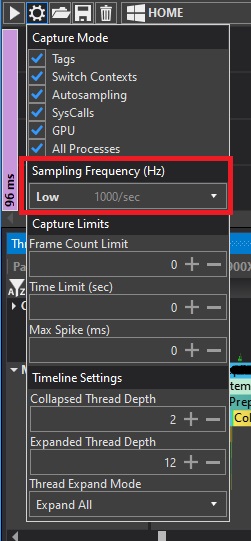
Further Settings
You can have more fine-grained control over the sampling and capture mode in general if you click on the Cog button next to the play button. Can be useful if you want to increase the autosampling frequency.
Optick can be tailored to attach many additionnal informations on the capture, threads and events. If your game need it don’t hesitate to jump into the Optick Gem to extend it for your needs.
Using Superluminal profiler (Windows-only)
Superluminal is a Commercial profiler, it offers a trial period but you have to buy a license past this trial if you want to continue using it. To prevent licensing issues we won’t attach screenshots and we recommend you to have a look at the official documentation .
The Superluminal Gem is not required to use Superluminal with o3de, it will only offer some instrumentation data on top of the existing sampling data.
Grabbing the application
You can download Superluminal
from the main website . During the installation process, if you decide to not use the default installation folder (C:/Program Files/Superluminal) you will have to update the CMake variable SUPERLUMINAL_API_PATH if you enable the Superluminal o3de Gem.
Launch a capture
You can open Superluminal directly, it will be in charge of launching o3de. Under the Start menu on the left click on the Run button and fill-up the following fields :
- Application: The path to your
Editor.exeor your exported game - Working Directory: You can use the same folder as your executable
- Commandline Arguments: If you use the editor, enter
--project-path="C:/path/to/your/project"
Then under Capture Options
- Tick
Enable PerformanceAPI eventsif you enabled the Superluminal Gem - Untick
Enable child process profilingso that the asset processor don’t add noise to your capture - Untick
Start profiling immediately
You are ready to press Run ! The editor or your game will boot. When you are ready, click the Start Recording button and the capture will start. Stop it when you are done, after a bit the capture will be ready to navigate.
Navigate your capture
The layout is close to Optick so the same terms will be used. The Event Timeline contains both sampling and instrumenting events. The sampling events are blue whereas the instrumenting events have a color attributed to their category (Physics, System, etc).
By default all threads are in a collapsed state in the timeline , so you will want to expand the main thread dropdown on the left side.
Navigation is done using the mouse :
- Hold right click to move through the Event Timeline
- Use the mouse wheel to scroll up and done in the Event Timeline
- Hold ctrl and use the mouse wheel to zoom-in and out of the Event Timeline
And left click is used for quick filtering :
- Left click on an event in the Event Timeline to select it, the Sub-Windows will use it as the top item
- Left click and drag on the Event Timeline will limit the Sub-Windows analysis to the selected area.
See the Frame Navigator
Superluminal has no notion of frame, but it can take any event and display all of its occurences in a similar look as Optick Frame Navigator. Simply right click on the main loop event (CryEditApp::OnIdle for the editor) and click Find all occurences. You will see to tab at the top showing the occurences as a column chart with their ms time. This tab is called the
Instance Graph
The first few calls might be longer than usual as the capture was warming up, so you might want to drag select on the timeline before doing the filtering to only show the occurences in your selected range. Another important points is that the column chart is ordered by performance, not by frame number so that the most expensive frames will be shown first.
Navigate the Thread Interaction
Right above each thread dropdown you have the Thread Interaction view . The green area is when the thread is executed whereas the red areas shows when the thread is waiting. If you click on a red area, it will open a view at the bottom showing what the thread is waiting for, for how long, and what resolved it.
Using Pix profiler (Windows-only)
Pix is a free profiler made by Microsoft. Originaly made to profile GPU event for DirectX12, it is now able to profile the CPU. To prevent licensing issues we won’t attach screenshots and we recommend you to have a look at the official documentation and this official youtube playlist .
Caution:At the time of writing the Pix is not implemented as a Gem in o3de, so you have to build the engine from source if you want to use it
Grabbing the application
You have to download both the application and the WinPixEventRuntime library from the Microsoft website . Installing the application should be straightforward, but there are specific steps to do in order to provide WinPixEventRuntime to o3de.
- Download the nuget package from the nuget website (look for Download package on the right below the “About” section).
- Change the extension of the file from
.nugetto.zip - Unzip the file, and rename the directory to
winpixeventruntime - Copy the folder to your
$LY_3RDPARTY_PATHfolder. By default on windows it isC:\Users\YOUR_NAME\.o3de\3rdParty - Set the CMake flag
LY_PIX_ENABLEDto on and reconfigure the build (-DLY_PIX_ENABLED=ONon your configure command)
After recompiling you will be able to use PIX with o3de.
Launch a capture
PIX is in charge of launching o3de so just launch the PIX application. You will have to fill the following fields under Select Target Process (pick Launch Win32) :
- Path to executable: The path to your
Editor.exeor your exported game - Working directory: You can use the same folder as your executable
- Command line arguments: If you use the editor, enter
--project-path="C:/path/to/your/project" - Launch for GPU Capture: Make sure it is unticked as we are profiling the CPU
You can then click Launch to start the editor/game. When you are ready to capture, click Start Timing Capture to start the capture, and click on the same button again to stop it.
Navigate your capture
You will be greeted by the Capture Summary. For a first overview you should pick the Timeline tab to browse the events per frame.
Navigation is done using the mouse :
- Hold right click to move through the Event Timeline
- Use the mouse wheel to scroll up and done in the Event Timeline
- Hold ctrl and use the mouse wheel to zoom-in and out of the Event Timeline
And left click is used for quick filtering :
- Left click on an event in the Event Timeline to select it, the Sub-Windows will use it as the top item
- Left click and drag on the Event Timeline will limit the Sub-Windows analysis to the selected area.
Basic Search
If you want to find a specific event, use the Range Details tab at the bottom and start typing the name of the event.
- You can filter-out threads from your search via the
Selectorview below. The event found will be shown on the right with their callstack. - You can right click on an event and press
Show in Timelinein order to focus on it.
Context Switch
Above each thread you can see red lines for each context switch that occurs. If you click on it you can see which threads caused this context switch to occur and for how long we waited.