IN THIS ARTICLE
Google Trace Event Format Metrics
Learn the JSON Trace Event Logger
The Trace Event Logger in Open 3D Engine (O3DE) provides the ability to log metrics compatible with the Google
Trace Event Format .
The implementation is a limited subset of Google Trace format and only events types relevant for O3DE needs at the time have been implemented.
O3DE currently supports the following set of events:
| Events | Description | Phase Markers |
|---|---|---|
| Duration | Provides a way to measure duration within a single thread. Duration events can be nested | B (begin), E(end) |
| Complete | Combines the Begin and End of a Duration Event into a single event. | X |
| Instant | Corresponds to an event that occurs at a point in time. It has no duration associated with it. For example an out of memory event might be logged as an “instant” event. An “s” scope parameter is available to provide the scope of the event. Valid scopes are “g” (global), “p” (process), “t” (thread). If no scope is provided it is assumed to be a thread scope event. | i |
| Counter | Provides a way to track multiple values over time. When an “id” is provided , it combines with the “name” field to form the counter name. | C |
| Async | Provides a way to measure asynchronous operations across multiple threads. This event may be used to output the frame time or network I/O stastistics. Events with the same “cat”(category) and “id” field values are considered to be from the same event tree. The “scope” argument is an optional string used to avoid id conflicts. When specified the “cat”, “id” and “scope” will be used to identify an event from the same event tree. | b (nestable start), n (nestable instant), e (nestable end) |
The following set of events are not provided by the JSON Trace Event Logger in O3DE currently:
| Events | Description | Phase Markers |
|---|---|---|
| Flow | Similar to an asynchronous event, except each thread can have a duration associated with it. | s (start), t (step), f (end) |
| Object | Provides a way to build complex structures in events. Normally used to track when an object instance is created(“N”) and destroyed(“D”) in-memory. The “O” object can be used to associate “snapshot” data with an object, which can be anything that is storable in an JSON object. | N (created), O (snapshot), D (destroyed) |
| Metadata | Allows associating associating custom data with one of the supported fields(“process_name”, “process_labels”, “process_sort_index”, “thread_name”, “thread_sort_index”). The “args” argument is used to specify that metadata. | M |
| Memory Dump | Corresponds to a memory dump of either the global OS memory or the running application process memory. The “V” phase is used for a global memory information such as system ram. The “v” phase is used for process statistics. | V (global), v (process) |
| Mark | (Not Needed for O3DE) Used for logging events when a web navigation timing API is used. | R |
| Clock Sync | (Not needed for O3DE) Used to perform sync clock synchronization among multiple event logs. | c |
| Context | Used to mark a sequence of events belonging to a context. | , |
More information about each of these events can be found in the Event Descriptions section of the Google Trace Event Format document.
Event Logger API documentation
Detailed doxygen comments on the available interfaces for the Event Logger API is located within the header API files located within the
Code/Framework/AzCore/AzCore/Metrics directory.
Within that directory the following are the most important files to examine to learn about the API:
| File | Description |
|---|---|
| IEventLogger.h | Provides the interface for recording event data via using an Event Description. Structures definitions for specific Event Phase Types are also described in this file. |
| IEventLoggerFactory.h | Provides the interface for registration of Event Loggers with a global registrar. This can be used to access Event Loggers accross shared library boundaries or access an EventLogger without the needing to store it explicitly. |
| EventLoggerUtils.h | Contains utility functions to simplify recording of events using the Event Logger API. The functions can both query and Event Logger from the Event Logger Factory and record and event in a single call. This file also provides the simplified AZ::Metrics::RecordEvent api which can accept any type of supported Event Phase Type. |
How to use the JSON Trace Event Logger
This section describes how to register to create an Event Factory and register it with a global interface, create an Event Logger, provide the Event Logger stream to record data output and to record sample metrics. By the end you will be able to view collected metrics in a Chromium-based browser.
The full source code in this section is available in the JsonTraceEventLogger Unit Tests and EventLoggerUtils Unit Tests
Create EventLogger Factory and register it as a global instance
//! The logger is created from a compile time hash of the "SampleEventLogger" string using the FNV-1a 64 bit algorithm
constexpr AZ::Metrics::EventLoggerId SampleLoggerId{ static_cast<AZ::u32>(AZStd::hash<AZStd::string_view>{}("SampleEventLogger")) };

//! This is a google test fixture class used for illustration purposes of recording using the Event Logger API
class JsonTraceEventLoggerTest
    : public ::UnitTest::ScopedAllocatorSetupFixture
{
public:
    JsonTraceEventLoggerTest()
    {
        // Create an event logger factory
        m_eventLoggerFactory = AZStd::make_unique<AZ::Metrics::EventLoggerFactoryImpl>();

        // Register it as a global instance
        AZ::Metrics::EventLoggerFactory::Register(m_eventLoggerFactory.get());

        //...
    }

protected:
    AZStd::string m_metricsOutput;
    AZStd::unique_ptr<AZ::Metrics::IEventLoggerFactory> m_eventLoggerFactory;
};
Create a JSON Trace Event Logger that writes to an in-memory string and register it with the Event Logger Factory
    JsonTraceEventLoggerTest()
    {
        //... Previous logic to register event factory

        // Create an byte container stream that allows event logger output to be logged in-memory
        auto metricsStream = AZStd::make_unique<AZ::IO::ByteContainerStream<AZStd::string>>(&m_metricsOutput);
        // Create the trace event logger that logs to the Google Trace Event format
        auto eventLogger = AZStd::make_unique<AZ::Metrics::JsonTraceEventLogger>(AZStd::move(metricsStream));

        // Register the Google Trace Event Logger with the Event Logger Factory
        auto registerOutcome = m_eventLoggerFactory->RegisterEventLogger(SampleLoggerId, AZStd::move(eventLogger));
        // Validate that the registration of the factory succeeded
        EXPECT_TRUE(registerOutcome);
    }
Generate duration trace metrics and record them to the Event Logger
The following block of code shows how to record a string and a number using the event logger:
{
    constexpr AZStd::string_view eventString = "Hello world";
    constexpr AZ::s64 eventInt64 = -2;


    // Populate the "args" container to associate with each events "args" field
    AZ::Metrics::EventObjectStorage argsContainer;
    argsContainer.emplace_back("string", eventString);
    argsContainer.emplace_back("int64_t", eventInt64);

    {
        // Record Duration Begin and End Events
        AZ::Metrics::DurationArgs durationArgs;
        durationArgs.m_name = "Duration Event";
        durationArgs.m_cat = "Test";
        durationArgs.m_args = argsContainer;
        durationArgs.m_id = "0";
        auto resultOutcome = AZ::Metrics::RecordEvent(SampleLoggerId, AZ::Metrics::EventPhase::DurationBegin, durationArgs);
        EXPECT_TRUE(resultOutcome);

        // Update the string value to "GoodbyeWorld and the integer value to "400"
        argsContainer[0].m_value = "Goodbye world";
        argsContainer[1]= 400;

        // Re-update the durationArgs argument container to have the latetst argument values
        durationArgs.m_args = argsContainer;

        resultOutcome = AZ::Metrics::RecordEvent(SampleLoggerId, AZ::Metrics::EventPhase::DurationEnd, durationArgs);
        EXPECT_TRUE(resultOutcome);
    }
}
Flush the metrics string to a text file
At this point the the metrics can be logged to stdout, sent over the network or written to a JSON file on disk.
The example will write the metrics a file named with the prefix “sample_metrics_” with the current time formatted using the
ISO 8601 standard. An example filename is sample_metrics_2023-01-01T120000.123456.json.
{
    constexpr AZ::IO::OpenMode openMode = AZ::IO::OpenMode::ModeWrite;
    auto metricsFilepath = AZ::IO::FixedMaxPath(AZ::Utils::GetProjectUserPath()) / "metrics/sample_metrics_";
    //! Append a ISO 8601 timestamp to the metrics filename to make it unique across runs
    AZ::Date::Iso8601TimestampString currentUtcTimestamp;
    AZ::Date::GetFilenameCompatibleFormatNowWithMicroseconds(currentUtcTimestamp)
    metricsFilepath.Native() += currentUtcTimestamp;
    metricsFilepath.Native() += ".json";

    AZ::IO::SystemFileStream systemFileStream(metricsFilepath.c_str(), openMode);
    // The metrics were written to the ByteContainerStream which was backed by the @m_metricsOutput member
    systemFileStream.Write(m_metricsOutput.size(), m_metricsOutput.c_str());
}
Event Metrics JSON output
The following example shows logging of metrics using multithreads, to illustrate that the thread ID is associated with each metric.
[
  {"name":"Duration Event","id":"0","cat":"Test","ph":"B","ts":1664329933375019,"pid":31760,"tid":36036,"args":{"string":"Hello world","int64_t":-2}},
  {"name":"Duration Event","id":"0","cat":"Test","ph":"E","ts":1664329933375119,"pid":31760,"tid":36036,"args":{"string":"Goodbye world","int64_t":400}}
]
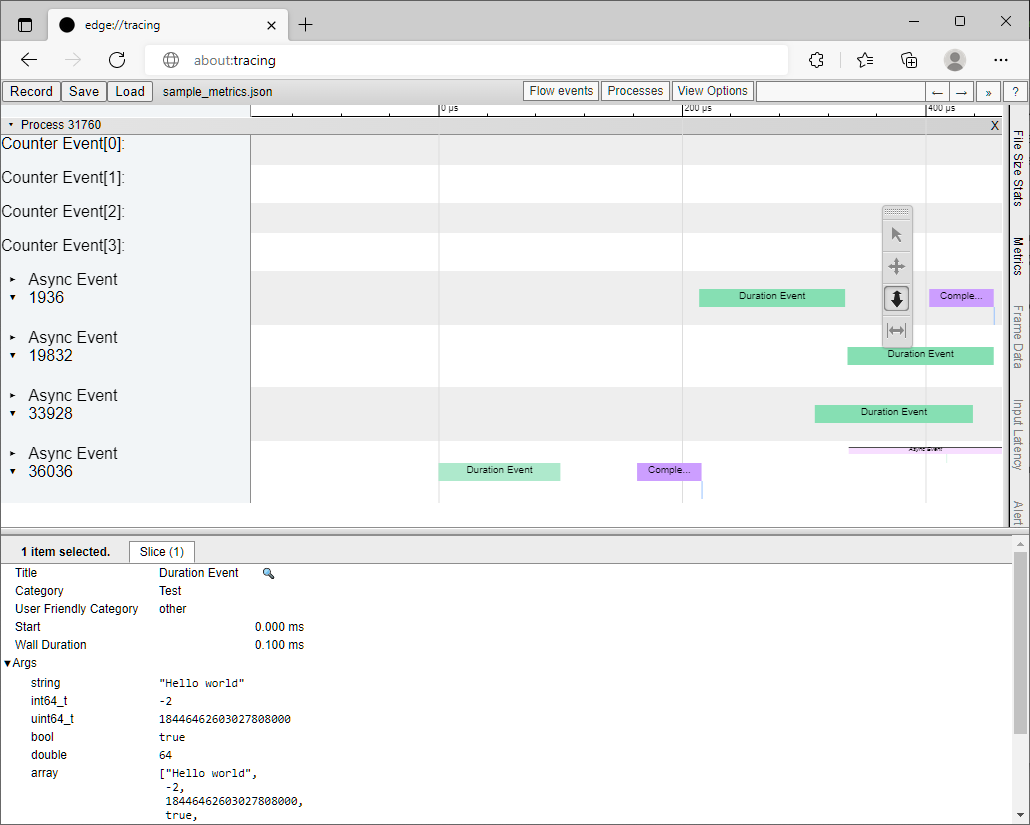
Viewing the event metrics
Using a Cchromium-based browser about:tracing page or the trace-viewer provided by the
catapult repo , the recorded metrics can be visualized based on their event types.