IN THIS ARTICLE
Script Canvas Functions
The Script Canvas Editor enables you to create reusable graphs, called functions. A function is available for use as a node in your Script Canvas graphs. Similar to functions in traditional programming languages, functions in the Script Canvas Editor promote code reuse and abstraction. They help simplify your graphs by replacing a group of nodes that perform a specific task with one function node. For example, you could move a series of nodes that perform linear interpolation into a function called Interpolate, and move nodes that perform acceleration clamping into a function called ClampAcceleration. Additionally, if you’re using this functionality in multiple graphs, functions make updates easier because you need to make changes only in one place.
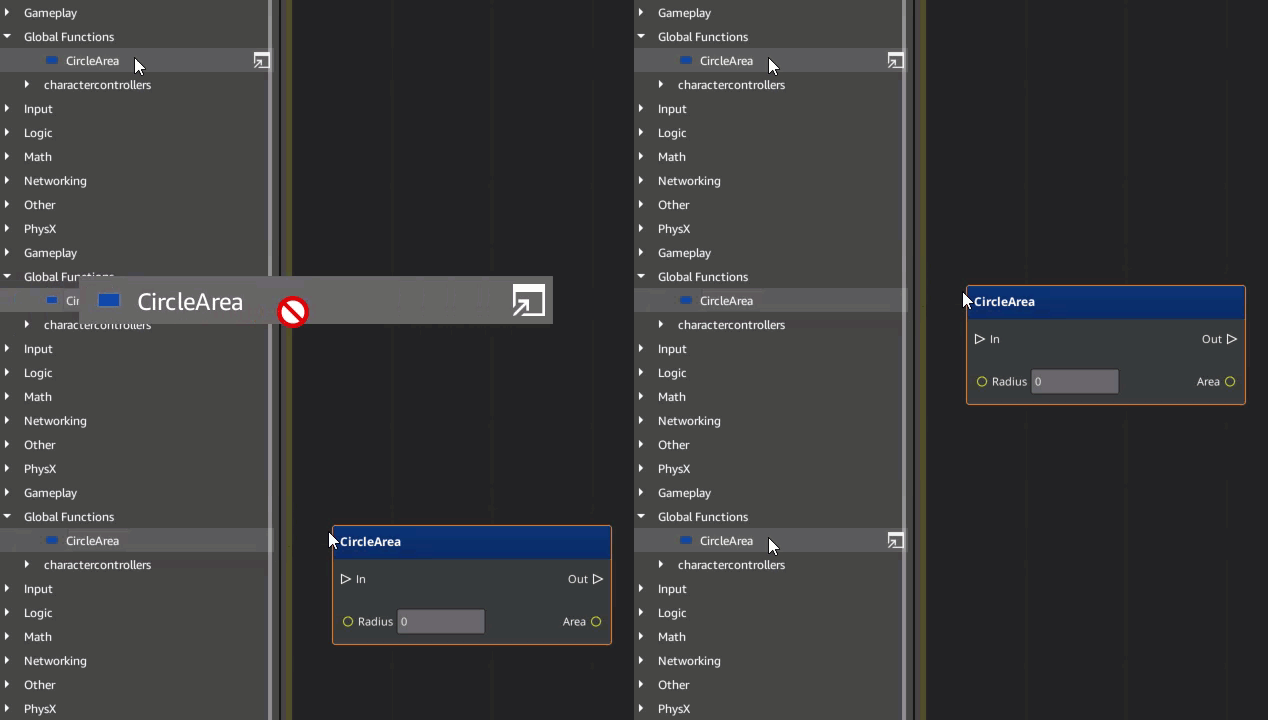
Your function appears alongside all the other Script Canvas nodes in the Node Palette, categorized under Global Functions.
When you create a function, you define the input and output variables of that function, and all the nodes in between that produce a result.
Creating a Script Canvas function
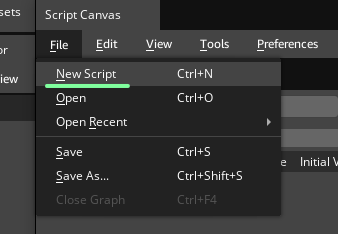
Start creating a new function by choosing File, New Script in the Script Canvas Editor.
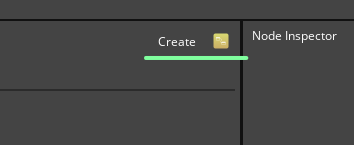
Alternatively, you can create a new script using the create button located in the upper right corner of the editor canvas.
Function entry and exit points
Functions require entry and exit points. To create these points, right-click a node’s input or output execution slot and select Expose in the context menu. Typically, you create an entry point node from the input execution slot of the first node in your function, and an exit point node from the output execution slot of the last node in your function.
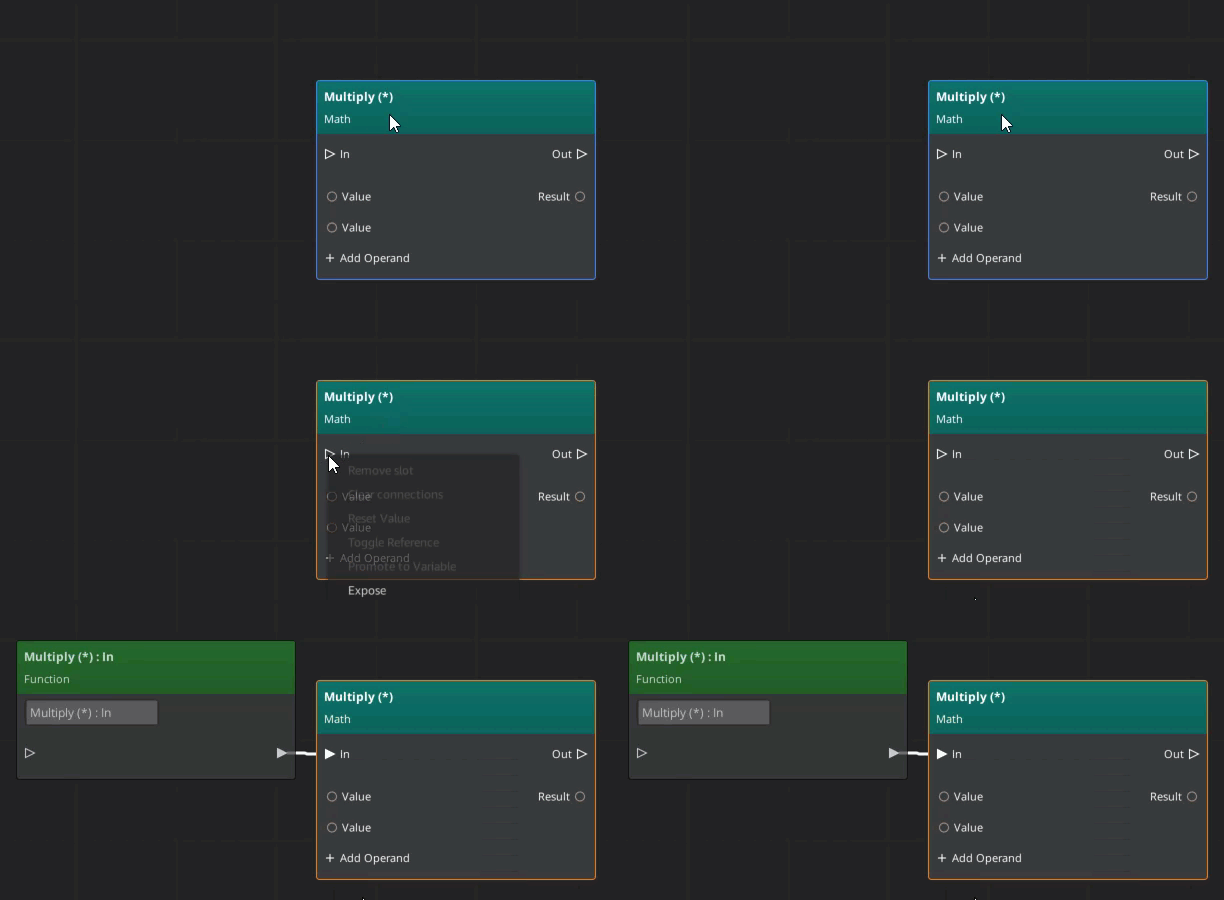
Note:To change the names of the execution slots on the function’s node, edit the name field on the entry point or exit point node.
Optionally, if you’re not certain how you want to connect an entry or exit point to the rest of your function, you can create an entry or exit point node using the toolbar buttons:  . Connect its execution slot later, when you’re ready.
Function data parameters
Functions can also have input and output data parameters. Input parameters are the values that are passed in to the function. Output parameters are the values that are returned by the function. These are both defined as variables in the Variable Manager. A function can also have local variables, which are not exposed on the function’s node.
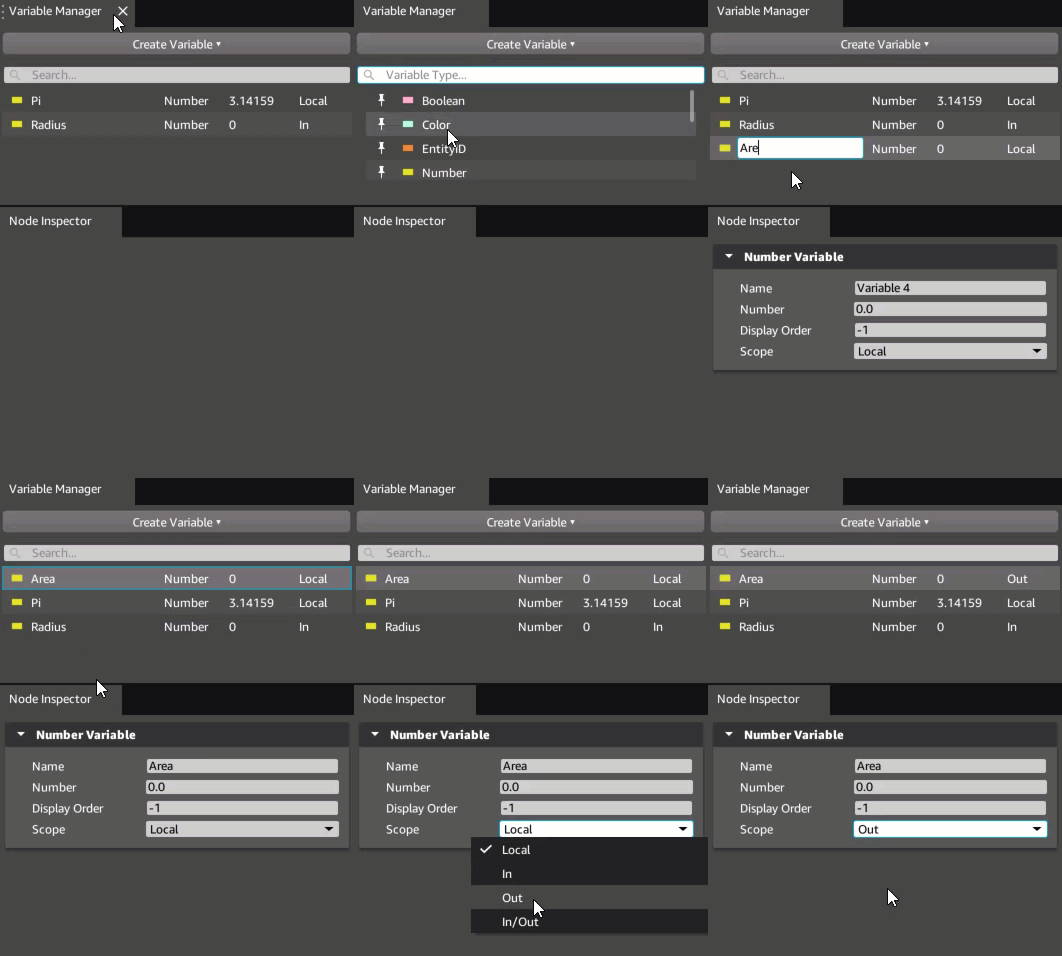
The scope of a variable determines if and where the variable will appear on the function node.
| Scope | Location on Node | Usage |
|---|---|---|
| Local | (None) | This is a local variable, for use only by the function. |
| In | Input slot | This is an input parameter. A value for this variable is passed in to the function. |
| Out | Output slot | This is a result variable. The function returns its value as a result. |
| In / Out | Both sides | This is an input parameter that can be modified by the function and returned as a result. |
Using a Script Canvas function in a graph
Once a Script Canvas function has been saved, it automatically shows up in the Node Palette, under Global Functions. The default directory for new functions is your project’s scriptcanvas\functions directory. If you save them in a subdirectory, or save them under a different project directory, the directory structure is used to categorize the functions within Global Functions.
Using a function is just like using any other node in Script Canvas. Simply drag and drop the function into a graph. When it’s dropped, a node that represents the function is displayed on the canvas.
Function example: Linear interpolation
In this example, we create a linear interpolation function. This function is represented by the formula: Result = Start + Time * (End - Start).
In this example you will learn how to do the following:
- Create entry and exit points for a function.
- Create input parameter slots.
- Create return values.
The final function graph should look like this:

Start a new function using File, New Script or by using the function create button in the upper right corner of the canvas.
Click the left side Create execution nodeling button to make an input node on the canvas.
Click the + button next to Add data input to add an input parameter to the execution nodeling. This will prompt you for a name and type of the new variable. Enter Start as the name and Number as the type. Repeat this twice more for Time and End
In the Node Inspector expand the Math category.
Drag an Add, Subtract, and Multiply node onto the canvas and arrange them similar to the image above.
Using variable references, do the following:
a. In the Subtract node, reference the End and Start variables, so that Start is subtracted from End.
b. In the Multiply node, use the result of the subtraction and reference the Time variable, so that (End - Start) is multiplied by Time.
c. In the Add node, use the result of the multiplication and reference the Start variable, so that these two values are added together.
Create an exit point for your function.
a. Click the right side Create execution nodeling button to make an output node on the canvas.
b. Click the + button next to Add data output to add an input parameter to the output execution nodeling. This will prompt you for a name and type of the new variable. Enter Result as the name and Number as the type.
c. Result will appear in the list of variables under the Variable Manager. Drag it onto the canvas and select Set Result from the menu that appears.
d. Drag the new setter node between the Add node and the output execution nodeling.
Drag a connection from the Add node output to the Result node In connector. Drag the Add node’s Result pin to the Result node’s number value.
Drag the Result node’s out connector to the output execution nodeling’s in connector.
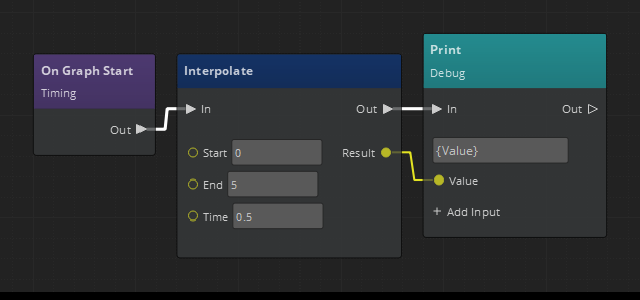
Finally, use File, Save to save the function and name it Interpolate. The function is now ready to use in a Script Canvas graph:
